Pixl Envy / Case 01 / Hospitality / Beach resort
A better booking experience. An organic revenue engine.
Pixl Envy connected search intent, resort evaluation, and the booking journey so qualified guests could move from discovery to reservation with less uncertainty.

Client
Casa Del Mar
The assignment
Improve the digital guest experience and increase booking revenue from organic search—without relying on paid advertising.
Evidence window
Performance record: 2017–2024
Pixl Envy role
- Experience strategy and UX
- Organic search strategy
- Booking journey conversion engineering
- Analytics and revenue measurement
2024 / Organic performance
Organic search became the primary revenue engine.
In 2024, Organic Search generated $1,632,926.40—67.53% of Casa Del Mar's $2,418,106.88 in total revenue—without paid advertising.
- Organic Search
- 67.53%$1,632,926.40
- All other revenue
- 32.47%$785,180.48
- Organic Search revenue
- $1.63M
- $1,632,926.40 in tracked 2024 revenue
- Share of total revenue
- 67.53%
- Attributed to Organic Search in 2024
- Organic users
- ~36K
- Approximately 36,000 users in 2024
- Average purchase revenue per user
- $42.61
- 2024 average purchase revenue per user
Long-term context / 2017–2024
$1,125,236.82 $2,418,106.88
Across the available annual record, total revenue moved from $1,125,236.82 in 2017 to $2,418,106.88 in 2024. That is $1,292,870.06 in additional annual revenue, a 114.9% increase.
Long-term business context, not a claim that organic search alone caused every dollar of change.Archived outcome / 2018
More commercial value from the demand already present.
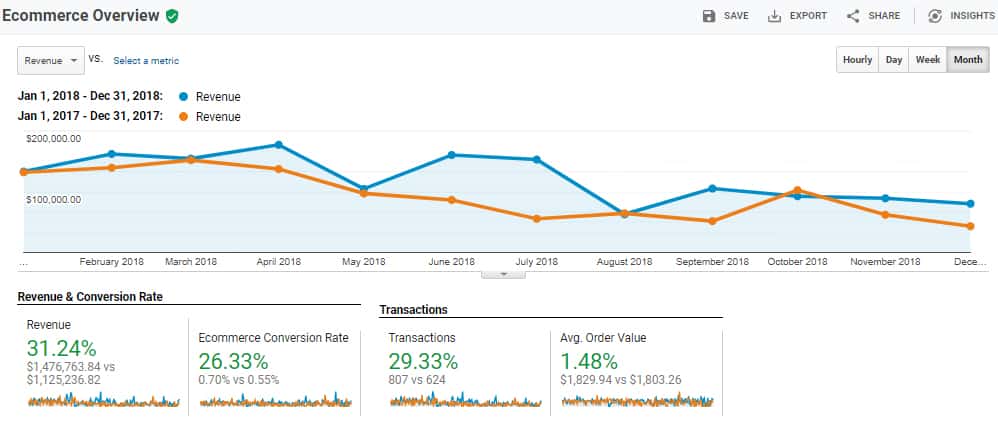
Annual Google Analytics evidence compares January 1–December 31, 2018 with the same 2017 period.
- Revenue
- +31.24%
- 2018 compared with 2017
- Ecommerce conversion rate
- +26.33%
- 2018 compared with 2017
- Transactions
- +29.33%
- 2018 compared with 2017
- Average time on page
- +23.88%
- 2018 compared with 2017
The diagnosis
The traffic problem was really a decision problem.
The useful question was not how to buy more traffic. It was whether an organically acquired guest could understand the resort, find the right accommodation, and reach a confident booking decision without friction.
The diagnostic work reviewed prior-year analytics, checkout abandonment, converting and non-converting traffic patterns, and the competitive experience. That shifted the brief from generating visits to making qualified organic demand easier to understand and act on.
The intervention
Turn behavior into an operating brief.
The work connected measurement, experience, conversion, and commercial outcomes instead of optimizing them as separate assignments.
Connect intent to experience
Align organic landing experiences with what prospective guests need to understand when they arrive from search.
Make the resort legible
Organize accommodations, amenities, location, and proof around the questions a guest resolves before committing to a stay.
Engineer the booking path
Reduce friction between resort discovery, unit evaluation, availability, and the final reservation flow.
Measure revenue, not rank
Connect organic users to booking revenue and evaluate commercial movement instead of treating rankings or traffic as the finish line.
Experience artifact
Make the resort easier to evaluate before asking for the booking.
The archived experience placed the resort story, third-party recognition, accommodations, amenities, and booking paths into one continuous decision sequence.

Source evidence
The numbers remain attached to the record.
Each comparison below is reproduced from the preserved Google Analytics source capture and described in plain language.
Google Analytics compares January 1–December 31, 2018 with the same 2017 period. The source reports $1,476,763.84 in revenue compared with $1,125,236.82.
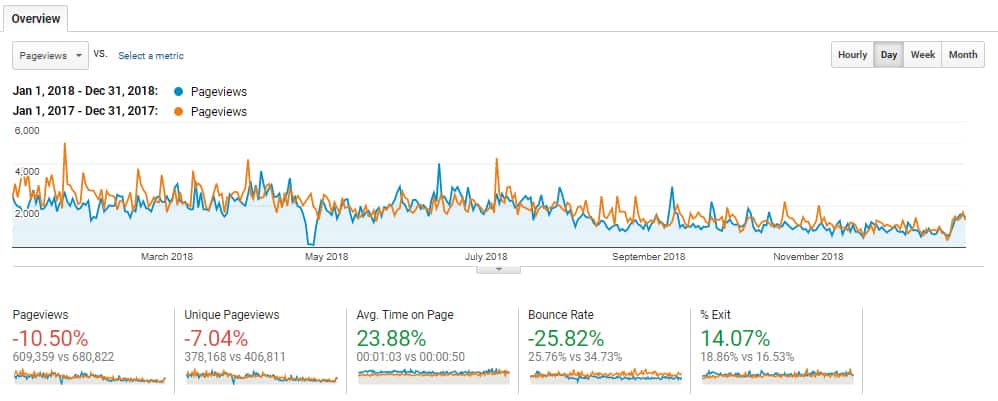
The same annual comparison shows average time on page up 23.88% and bounce rate down 25.82%. Pageviews were down 10.50%, reinforcing why volume alone was not the operating target.
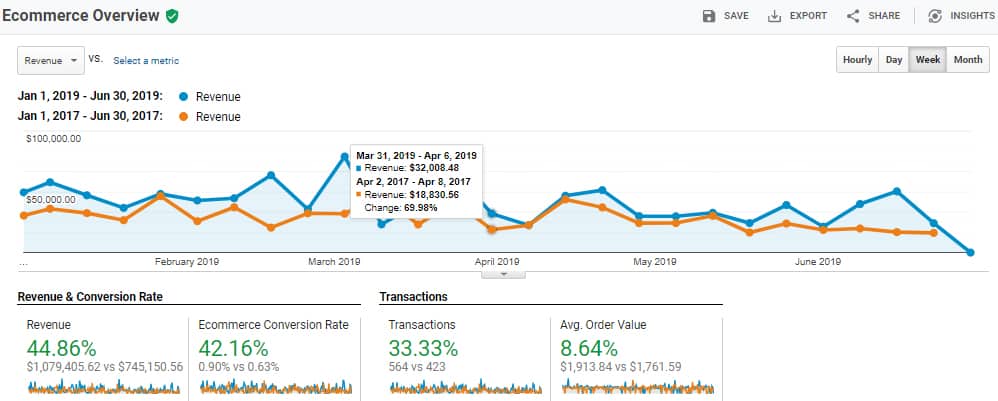
Google Analytics compares January 1–June 30, 2019 with the same 2017 period. The source reports $1,079,405.62 in revenue compared with $745,150.56.
Verified outcome / First half 2019
The commercial movement continued.
Google Analytics compares January 1–June 30, 2019 with the same 2017 period.
- Revenue
- +44.86%
- January–June 2019 compared with the same 2017 period
- Ecommerce conversion rate
- +42.16%
- January–June 2019 compared with the same 2017 period
- Transactions
- +33.33%
- January–June 2019 compared with the same 2017 period
- Average order value
- +8.64%
- January–June 2019 compared with the same 2017 period